Data (Days Since)
Track important milestones and events easily! The Data (Days Since) template helps you highlight key milestones by tracking the number of days since important events, like safety records, team victories, or business achievements. You can add multiple dates, with each event transitioning smoothly to keep your audience engaged. It's a great way to keep your team informed and motivated by celebrating successes and important moments.
Video: Template Tour
Content Source
Once you have created your slide using the Data (Days Since) template, choose a content source to start adding your content:
Web Portal
- Choose Web Portal in the Content Source dropdown
- Add your data,
- Click [Add Content] to input your data via the content editor and click [Save]
- Repeat steps a and/or b to add more content
- When you are ready to go live, add your slide to one or more playlists.
File Upload (XLSX)
- Choose File Upload (XLSX) in the Content Source dropdown
- Download the Data (Days Since) data template
- Use the data template (XLSX file) to add an optional title, summary and/or image.

- Save your XLSX file locally and upload the saved file into the slide editor
- When you are ready to go live, add your slide to one or more playlists
Google Sheets

Follow the prerequisite steps to set up your integration and get started with Google Sheets seamlessly.
- Vibe Portal - Download the VIBE-DATA-TEMPLATE_DataDaysSince.xlsx
- Google Drive - Upload the the VIBE-DATA-TEMPLATE_DataDaysSince.xlsx to your connected Google Drive folder and add your data
- Vibe Portal - Choose Google Sheets in the Content Source dropdown and select your saved Google Spreadsheet

Recommend Reading: Prep your Google Sheets
SharePoint (XLSX)
Follow the prerequisite steps to set up your integration and get started with using SharePoint Folders to store your Excel files.
- Vibe Portal - Download the VIBE-DATA-TEMPLATE_DataDaysSince.xlsx
- SharePoint - Upload the the VIBE-DATA-TEMPLATE_DataDaysSince.xlsx to your connected SharePoint folder and add your data
- Vibe Portal - In the slide editor, choose SharePoint (XLSX) in the Content Source dropdown and select your saved Excel file.
XLSX Data Template
If you have selected 'File Upload (XLSX)', 'Google Sheets' or 'SharePoint (XLSX)' as your content source, use this section as a guide for formatting the data in your spreadsheet.
Data Template Tips
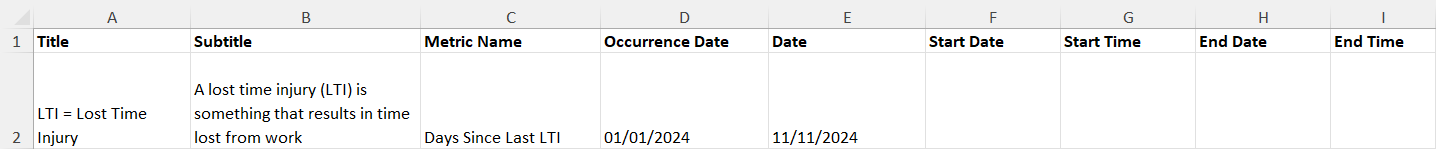
Download the data template from your slide portal and use the info below as a guide when completing each column:
- Title & Subtitle (Optional) - Free format text
- Metric Name (Recommended) - Free format text. Set the label for your day count.
- Occurrence Date (Mandatory) - Set the date that the event occurred.
Supported Data Formats
| Data Column | Supported Formatting |
| Title | Free format. Bold, underline formatting is supported. |
| Subtitle | Free format. Bold, underline formatting is supported. |
Metric Name | Free format. Bold, underline formatting is supported. |
| Occurrence Date | DD/MM/YYYY or MM/DD/YYYY |
| Date | DD/MM/YYYY or MM/DD/YYYY Start Date and End date are optional |
| Time | HH:MM (24hr) or HH:MM AM and HH:MM PM Start Time and End Time are optional |
Recommended Reading:
Common Data Entry Formats (for more information on managing your data)
Design
- Shape - Changing the shape for counting days can be a helpful way to visually represent data or track progress. By thoughtfully selecting shapes based on purpose or context, you can create a visual tracking system that is not only aesthetically pleasing but also functional and easy to understand.
- Image - Upload your own image to customize your slide is a great way to enhance its visual appeal and align it with your theme or purpose.
Slide Inspo
- Day Count (# of days since the event took place)
- Data Insights - Single Day Count
- Data Insights - Multiple Day Counts (wait a few seconds to see the transition...)
Asset Download
Take advantage of downloading our default assets as a guide to create your own, if you wish to change them.